Borough Emisions
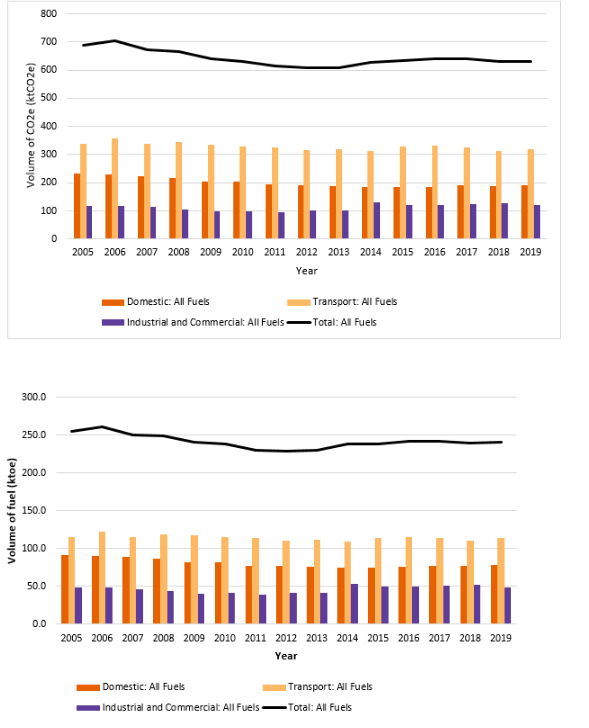
The total CO2e emissions produced from fuel (gas, electricity, coal, bioenergy, petrol, diesel) used within the borough for 2019 was 630.9 kt CO2 of which transport was the largest contributing sector, as shown in Figure 2.
Estimated total emissions for Chorley Borough in 2019 was 651.9 kt CO2e.
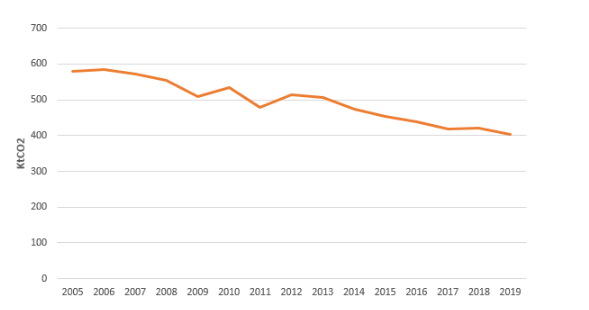
UK Government data shows that between 2005 and 2019 CO2e emissions have been gradually decreasing, as shown in Figure 4. This is largely due to the wider decarbonisation of the national energy system, particularly the electricity grid.
With an estimated 2019 population of 118,600 this equates to 5.5 t CO2 per capital.